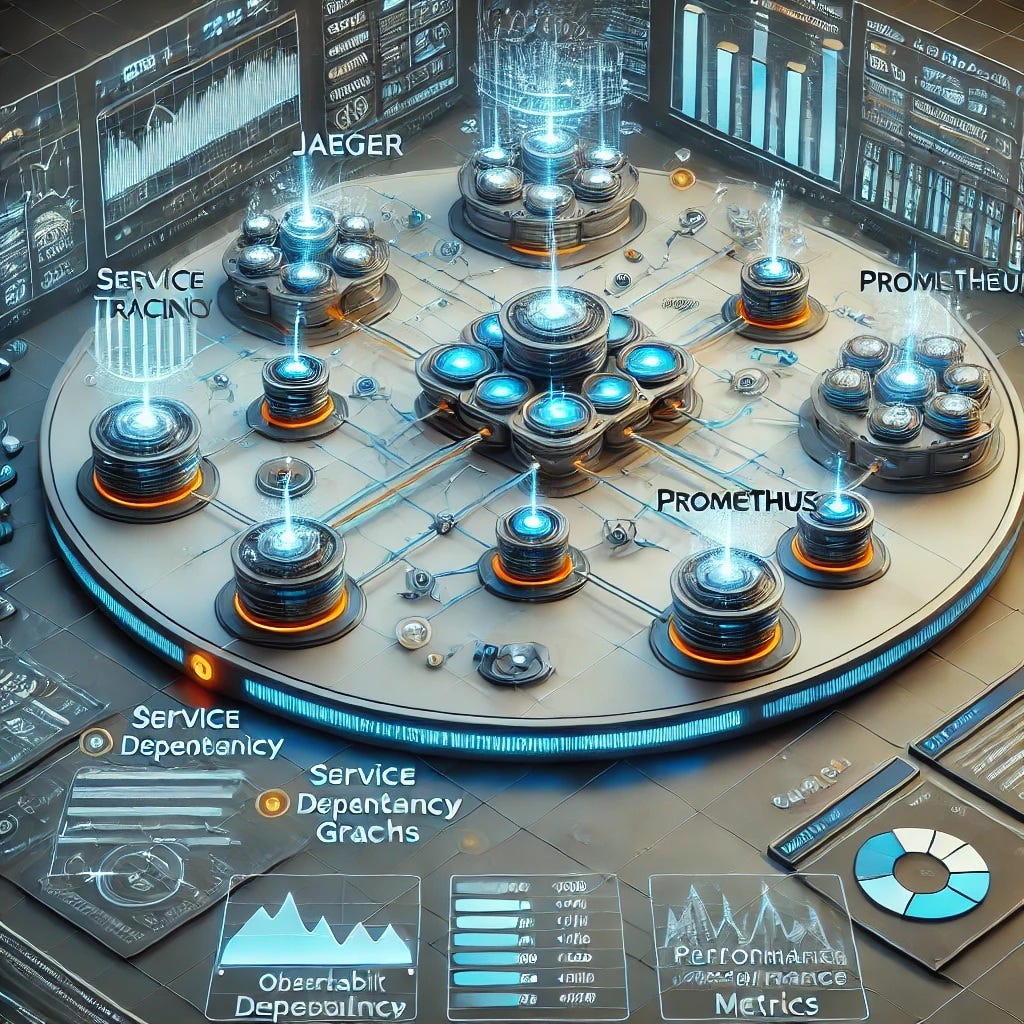
Distributed Tracing with Jaeger and Prometheus
Modern applications increasingly rely on distributed microservices to deliver seamless and scalable experiences. While microservices architectures offer flexibility and modularity, they also introduce complexity in monitoring and debugging inter-service communication. Distributed tracing emerges as a vital solution for addressing these challenges, providing end-to-end visibility into the lifecycle of requests as they traverse through multiple services.
Jaeger, an open-source distributed tracing system, enables developers to collect and visualize traces, analyze service dependencies, and identify performance bottlenecks. It captures a wealth of information about how requests flow through a system, allowing you to pinpoint latency issues or problematic interactions between services.
On the other hand, Prometheus, another open-source tool, specializes in monitoring and alerting. It complements Jaeger by providing metrics collection, querying capabilities, and alert management. Together, Jaeger and Prometheus create a robust observability stack that not only allows you to trace distributed systems but also to monitor and analyze performance in real time.
What is Distributed Tracing?
Distributed tracing is a critical observability technique designed to track the flow of requests as they traverse through a distributed system. In microservices architectures, a single request often interacts with multiple services before producing a response. These interactions can involve API calls, database queries, caching layers, and external dependencies. Distributed tracing enables developers and operators to visualize and analyze this flow, providing detailed insights into how different services interact and where potential bottlenecks or failures occur.
Unlike traditional logging or metrics, distributed tracing focuses on understanding the journey of a specific request, often represented as a "trace." Each trace is composed of smaller units called "spans," which correspond to individual operations or service calls. By aggregating and visualizing these spans, distributed tracing provides a clear picture of how requests propagate through the system.
Why is Distributed Tracing Important?
As applications evolve from monolithic architectures to microservices, debugging and monitoring become increasingly complex. In a monolith, identifying the root cause of a performance issue might involve looking at logs or monitoring a few metrics. However, in a microservices environment, where dozens or even hundreds of services may interact, pinpointing the source of a problem requires a more holistic approach. Distributed tracing addresses this by:
Providing End-to-End Visibility: It captures the entire lifecycle of a request, making it easier to understand the chain of events across services.
Diagnosing Performance Issues: By measuring latency between services, distributed tracing helps identify slow or failing components.
Understanding Service Dependencies: It reveals how services depend on one another, allowing teams to visualize the overall architecture and identify critical paths.
Facilitating Debugging: Traces provide granular details about errors or unexpected behaviors in specific services or interactions.
How Do Jaeger and Prometheus Fit In?
Jaeger and Prometheus are two open-source tools that address different but complementary aspects of observability. Jaeger is specifically designed for distributed tracing. It allows you to collect, store, and visualize traces from your microservices, helping you to diagnose latency and dependency issues. With Jaeger, you can identify which service or operation is contributing most to the overall latency of a request and drill down into specific spans to investigate further.
Prometheus, on the other hand, excels at metrics collection and alerting. While Jaeger focuses on tracing, Prometheus collects numerical data over time, such as request rates, error counts, and resource usage. By integrating Prometheus with Jaeger, you can augment trace data with detailed metrics, enabling you to monitor the performance and health of your entire system in real time.
Core Concepts of Distributed Tracing
Trace: A trace represents the journey of a single request or transaction as it moves through the system. It is composed of
multiple spans.
Span: A span represents a single operation or service call within a trace. Each span includes metadata such as operation name, start time, duration, and tags.
Context Propagation: Distributed tracing relies on propagating context (trace IDs and span IDs) across service boundaries. This is typically achieved using headers in HTTP requests or other communication protocols.
Sampling: To reduce overhead, distributed tracing systems often sample a subset of requests. This involves capturing only a fraction of traces, which still provides a representative view of system performance.
Use Cases for Distributed Tracing
Distributed tracing is particularly useful in the following scenarios:
Debugging Latency Issues: When users report slow responses, tracing helps identify which service or operation is introducing delays.
Failure Analysis: Traces can reveal where errors are occurring and how they propagate through the system.
Optimizing Performance: By analyzing traces, teams can identify inefficiencies such as redundant API calls or poorly tuned database queries.
Capacity Planning: Tracing, combined with metrics, helps teams understand resource utilization and prepare for scaling.
Overview of the Tools: Jaeger and Prometheus
Jaeger is a purpose-built distributed tracing system that integrates seamlessly with microservices frameworks. It provides features such as:
Trace Collection and Storage: Collects traces from your services and stores them for analysis.
Service Dependency Visualization: Displays a high-level view of how your services depend on each other.
Trace Querying and Analysis: Allows you to search for specific traces based on criteria like operation name, latency, or
error codes.
Prometheus complements Jaeger by focusing on monitoring and alerting. Its key features include:
Metrics Collection: Scrapes and stores time-series data from monitored services.
Querying Capabilities: Uses a query language, PromQL, to analyze metrics.
Alerting: Allows you to define rules and send alerts when specific conditions are met.
Together, these tools form a robust observability stack that allows teams to monitor, debug, and optimize their microservices applications effectively. In the subsequent parts of this tutorial, you will learn how to set up these tools and use them to trace and monitor a distributed application.


